Plots a time series, with the option to include confidence and prediction band
Plots a time series, with the option to include confidence and prediction band
plotTimeSeries(observed = NULL, predicted = NULL, x = NULL,
  confidenceBand = NULL, predictionBand = NULL, xlab = "Time",
  ylab = "Observed / predicted values", ...)
Arguments
| observed | observed values |
|---|---|
| predicted | predicted values |
| x | optional values for x axis (time) |
| confidenceBand | matrix with confidenceBand |
| predictionBand | matrix with predictionBand |
| xlab | a title for the x axis |
| ylab | a title for the y axis |
| ... | further arguments passed to |
See also
plotTimeSeriesResults
marginalPlot
tracePlot
correlationPlot
Examples
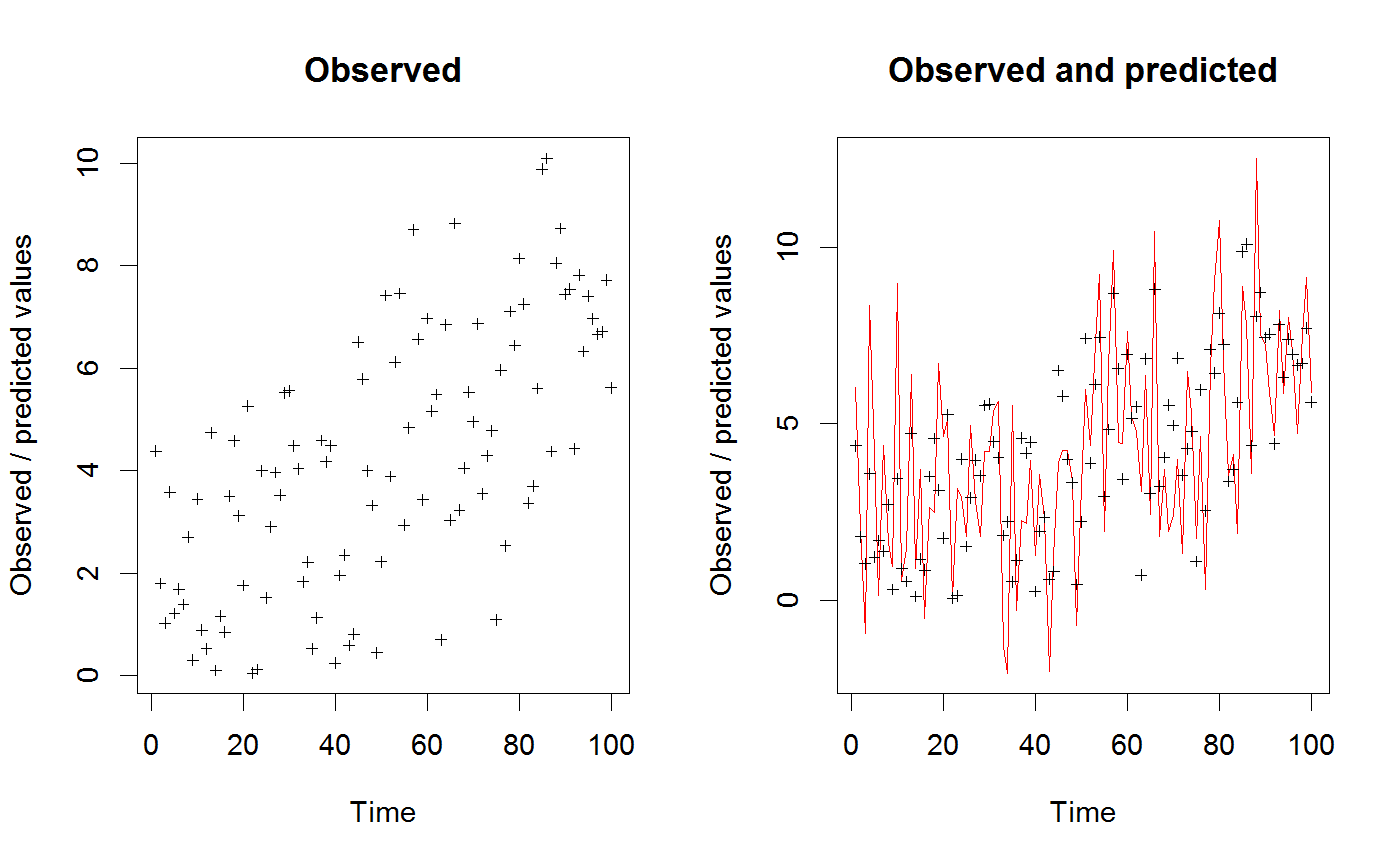
# Create time series ts <- VSEMcreatePAR(1:100) # create fake "predictions" pred <- ts + rnorm(length(ts), mean = 0, sd = 2) # plot time series par(mfrow=c(1,2)) plotTimeSeries(observed = ts, main="Observed") plotTimeSeries(observed = ts, predicted = pred, main = "Observed and predicted")par(mfrow=c(1,1))