Plot MCMC marginals
Plot MCMC marginals
marginalPlot(mat, thin = "auto", scale = NULL, best = NULL,
  histogram = TRUE, plotPrior = TRUE, priorTop = FALSE,
  nDrawsPrior = 1000, breaks = 15, res = 500, singlePanel = FALSE,
  dens = TRUE, col = c("#FF5000D0", "#4682B4A0"), lwd = par("lwd"), ...)
Arguments
| mat | object of class "bayesianOutput" or a matrix or data frame of variables |
|---|---|
| thin | thinning of the matrix to make things faster. Default is to thin to 5000 |
| scale | should the results be scaled. Value can be either NULL (no scaling), T, or a matrix with upper / lower bounds as columns. If set to T, attempts to retrieve the scaling from the input object mat (requires that this is of class BayesianOutput) |
| best | if provided, will draw points at the given values (to display true / default parameter values). Value can be either NULL (no drawing), a vector with values, or T, in which case the function will attempt to retrieve the values from a BayesianOutput |
| histogram | Logical, determining whether a violin plot or a histogram should be plotted |
| plotPrior | Logical, determining whether the prior should be plotted in addition to the posteriors. Only applicable if mat is an object of class "bayesianOutput" |
| priorTop | Logical, determining whether the prior should be plotted top (TRUE) or bottom (FALSE) |
| nDrawsPrior | Integer, number of draws from the prior, when plotPrior is active |
| breaks | Integer, number of histogram breaks if histogram is set to TRUE |
| res | resolution parameter for violinPlot, determining how many descrete points should be used for the density kernel. |
| singlePanel | Logical, determining whether all histograms/violins should be plotted in a single plot panel or in separate panels. |
| dens | Logical, determining wheter an density overlay should be plotted when 'histogram' is TRUE |
| col | vector of colors for posterior and prior |
| lwd | line width of the violin plots |
| ... | additional parameters to pass on to the |
References
Examples
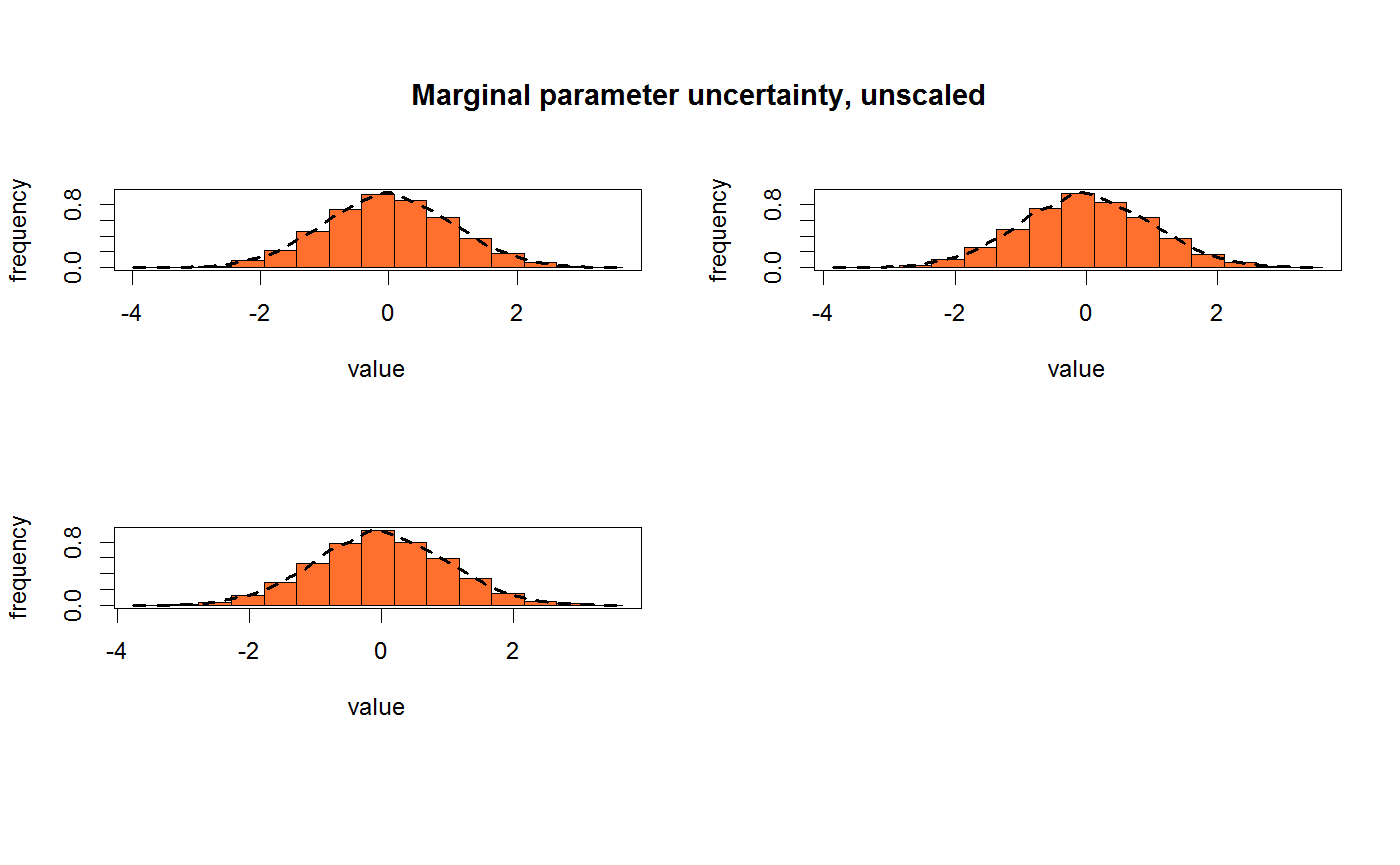
#> Warning: Parameter 'mat' is not of class 'bayesianOutput', set plotPrior to FALSE.