Species Richness Gradients Vary Across Phylogenetic Scales
Abstract
Aim: To determine how species richness gradients—commonly considered universal—vary across the phylogenetic hierarchy of birds and mammals, and to uncover how clade age and size predetermine the gradients. Location: Global. Time Period: Last 120 million years. Taxa Studied: Birds and mammals (~15,000 species). Methods: We used large‐scale phylogenies of birds and mammals and captured the species richness gradient for each of their monophyletic clades. Gradient strength was quantified with respect to latitude, environmental productivity and temperature using multiple measures (raw slopes, log transformation, log–log transformation, and correlations). To distinguish statistical from biological effects, we compared the observed gradients to those generated by null models that randomly reassigned species to clades while preserving the phylogeny and species distributions. Results: Species richness gradients show considerable variation. Small and young clades exhibited inconsistent gradients—including reverse or flat gradients—while older and larger clades converged on steep, consistent gradients. Even moderately large clades (~500 species) commonly displayed reverse gradients. Null models replicated this trend but only partially, implying that biological effects also drive gradient variation. These phylogenetic trends were sensitive to the choice of gradient measure: raw slopes frequently inflated the strength of this trend and the apparent differences among clades, while log and log–log transformations revealed only moderate trends. Main Conclusions: Species richness gradients are not universal, nor are they phylogenetic scale‐invariant. Instead, they follow systematic trends across the phylogenetic hierarchy. Young, small clades often bear signatures of their region of origin and historical dispersal, whereas older, larger clades converge on similar gradients. Recognising the variation and the phylogenetic trends within it elucidates the formation of biodiversity patterns. We offer guidelines for choosing gradient measures, arguing that multiple metrics, combined with careful use of null models, are necessary for a nuanced understanding of how, and why, global biodiversity patterns diverge from the presumed universal gradients.
What the paper shows and why it matters
(AI-generated)
The decline of species richness from the tropics towards the poles is a classic pattern in biology and is well documented for large groups. Smaller groups, however, show many other shapes, including reverse gradients, sometimes dismissed as idiosyncratic exceptions. Studies often assume, implicitly, that richness patterns look much the same however the studied group is delimited. This has rarely been tested across nested groups (clades, each an ancestor with all its descendants) of different age and size. Testing is difficult because part of any change with clade size may be statistical, and the measure of gradient strength may itself create trends. This is the assumption the paper examines.
The paper argues that the strength and direction of a species richness gradient depend systematically on the age and size of the group of species studied, so a gradient found in one part of the evolutionary tree need not hold in another. The study measured gradients for every clade of at least 10 species within birds and mammals. Small and young clades varied widely: reverse gradients occurred in 37% of all mammal clades and 36% of all bird clades analysed, and even clades of up to about 500 species often showed them, whereas larger clades converged on steep, classic gradients. A null model that randomly reassigns species to clades reproduced a weaker but similar trend and explained about half of the variation in gradient strength, so clade size explains part of the pattern, not all of it. Raw regression slopes often exaggerated this trend, whereas log and log–log transformations showed only moderate trends.
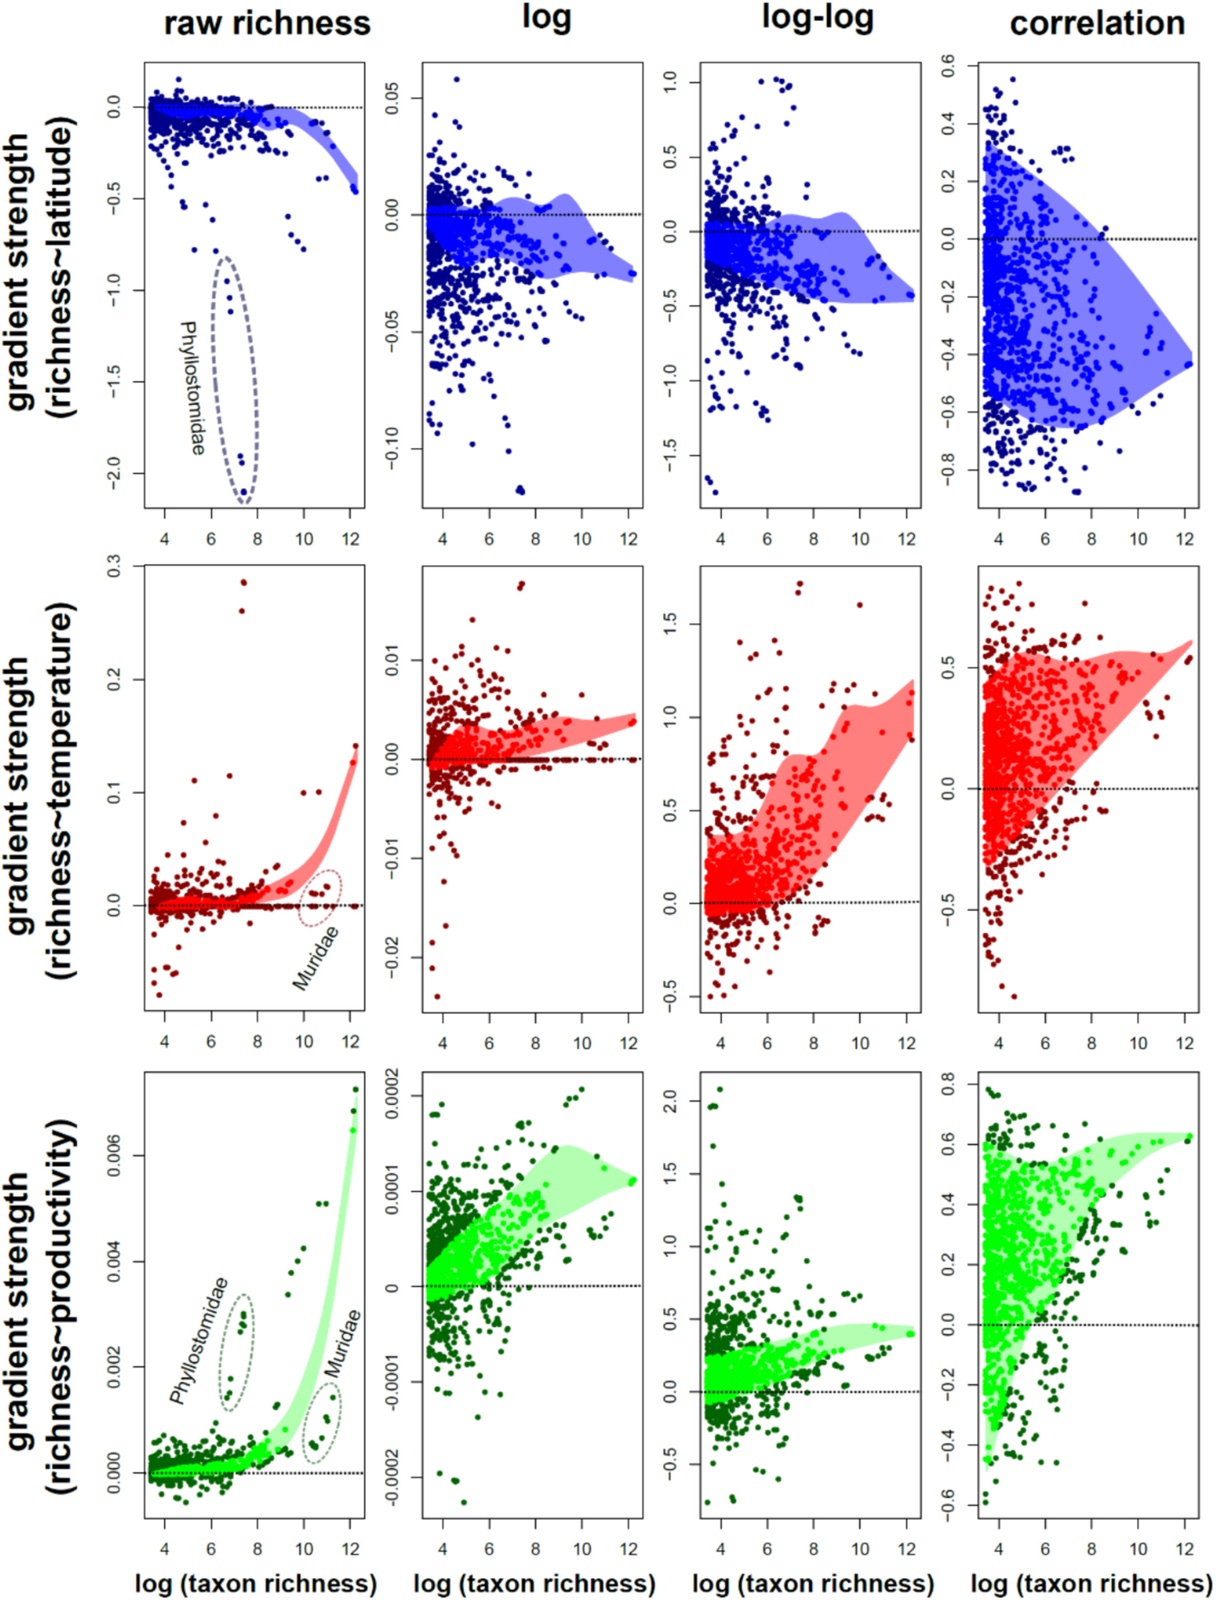
Gradients are thus neither universal nor the same at every level of the tree: the age and size of the studied group shape the gradient found, which may reconcile some contrasting results among earlier studies. The paper favours the view that the processes forming gradients change as clades grow, with young, small clades keeping the imprint of their region of origin and large clades converging on the classic pattern; this explanation is not tested directly. It suggests that some earlier work based on raw slopes, such as Hillebrand (2004), may need reinterpretation, and recommends matching the measure to the theory tested, using several measures when theory is weak, and applying null models before drawing biological conclusions.
References
- Hillebrand (2004). On the Generality of the Latitudinal Diversity Gradient. The American Naturalist 163, 192–211. doi:10.1086/381004